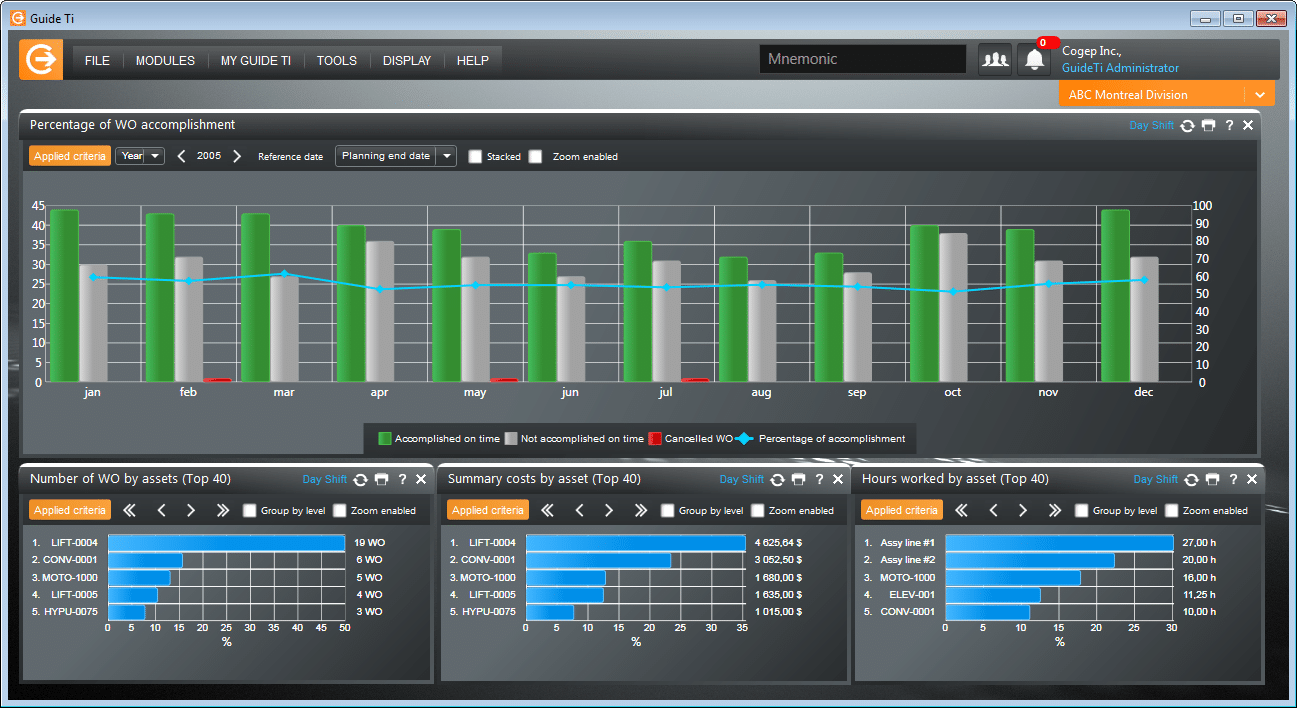
Get a quick overview of your maintenance performance and focus on issues and improvement opportunities
Reporting and KPIs for better decision making
By collecting, organizing, and visualizing your maintenance department’s most important metrics, you can get a quick overview of your maintenance performance and focus on issues and improvement opportunities.
Guide Ti comes with stunning reporting capabilities. The reports and visual graphics are fully customizable. You decide what data you want to access and what graphical representation options you want! Create the visual environment that suits you best, according to your needs and preferences.
The reporting and listing creation functions are simple and easy in Guide Ti. They are available on all screens and use the raw data available in Guide Ti, which lets managers analyze situations and respond quickly. Reporting and KPIs are easy with Guide ti!
Lists and reports available on all screens:
- Created by users
- Unlimited number of reports
- Functions accessible according to the user’s profile
- Automatic sending to individuals or groups
Visual graphic indicators from raw data visible directly on the desktop:
- Created by users
- Unlimited number of graphs
- Functions accessible according to the user’s profile
- Drill-down analysis
11 business challenges that CMMS Guide Ti can help you meet

Guide Ti is a maintenance management tool that has an impact on all of a company’s operations.
In fact, implementing good maintenance practices combined with the use of Guide Ti will help your organization be more competitive.
With Guide Ti, COGEP helps companies meet 11 challenges they face in their quest for excellence.

