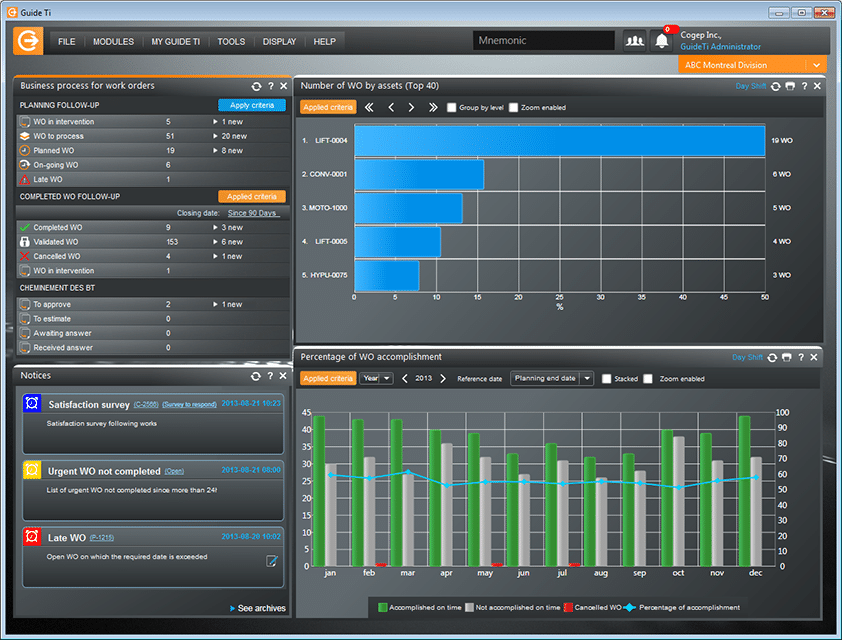
Guide Ti Advanced Dashboard is a business intelligence reporting and visual maintenance analytics module for ERPs or stand-alone.
Guide Ti’s Dynamic Dashboard translates real-time data from the CMMS into a powerful, easy-to-read graphical representation, including diagrams and pivot tables. This allows for quick and informed decision-making.
Combine the reporting features included in the software with the Advanced Dynamic Dashboard, a business intelligence reporting and visual maintenance analytics module, to bring them to their full potential.
The Advanced Dynamic Dashboard takes your data analysis a step further by, among other things, easily creating important KPIs and ratios to help you monitor and improve the efficiency of your maintenance department. You can view them directly on the desktop.
The module lets super users:
- Create numerous calculations
- Perform data comparisons
- Set up performance indicators
- Import data from other systems
- Perform data monitoring and business intelligence
Organizations can now easily access their data and KPIs in real-time or from a data repository to make informed decisions that help reduce maintenance costs and equipment downtime. Generate detailed reports with a few clicks, thanks to the drag and drop fields function. Customize the dashboard yourself without any programming skills. Create your key performance indicators (KPIs) so you can begin your reliability process to increase the life of your equipment.
Beyond tracking performance indicators, increase the visibility of your maintenance department within your organization
Guide Ti’s advanced dashboard module contributes to the visibility of your department and the effectiveness of your actions by gathering and analyzing data collected during the execution of your maintenance tasks. Straightforward interpretation of data is possible thanks to a dazzling visual representation that all company managers will appreciate and easily understand.
A valuable tool for optimizing operations in all departments of a company
From the Dashboard Module, you can generate performance reports on processes, such as work order management, planning and maintenance elements, that concern all departments of your organization.
By tracking ratios and indicators day after day, month after month, you can improve your department’s performance and be notified at any time of a situation that could affect your organization. Rigorous and simplified monitoring with Guide Ti lets you become an influential player in all operations. The easy-to-generate reports will facilitate communications with other departments.
Guide Ti’s Dynamic Dashboard module also integrates with major ERP systems
With this module, you can extract asset data in real-time from systems and databases such as SAP, Dynamics GP, Dynamics 365 for Finance and Operations (AX), Dynamics 365 Business Central (NAV), Oracle, JDE, and SAGE.
Simplicity, speed and flexibility are why generating a customized report in Guide Ti is a pleasant experience for the user.
Here are some features of the Advanced Dashboard Module
- Creation by super-users
- Include lists, reports and indicators
- Calculations – comparisons – targets
- Import data from other systems
- Alarms available
- Accessible from the Guide Ti workstation and the Web portal
- Functions accessible according to the user’s profile
- Analysis in drill-down mode
- Filter all graphs in a dashboard by selecting data in one of the graphs
Guide Ti’s dashboard indicators are indispensable tools for improving your organization’s performance!
To learn more, ask for our flyer on the Advanced Dashboard Module.
11 business challenges that CMMS Guide Ti can help you meet

Guide Ti is a maintenance management tool that has an impact on all of a company’s operations.
In fact, implementing good maintenance practices combined with the use of Guide Ti will help your organization be more competitive.
With Guide Ti, COGEP helps companies meet 11 challenges they face in their quest for excellence.

